Pictographs display data.

                           Every pictograph has a:

                                      title              labels
                                      key               pictures or symbols

Answer the questions using information displayed in the pictographs.


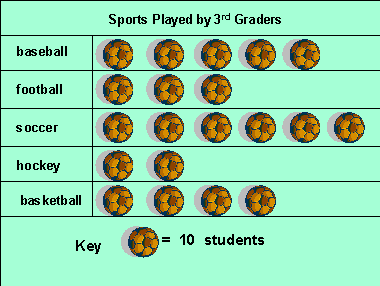
  This pictograph displays data.

  3rd grade students were asked what  
     sports they played.

  The graph shows that more students 
     played
soccer than any other sport.

  It shows that the fewest number of
    students played
hockey.

  The graph shows that more students
     played
baseball than football.

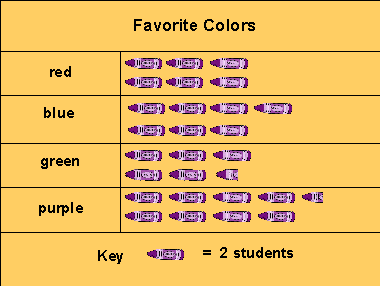
 This pictograph displays data.

  Students were asked their
     favorite colors.

  The graph shows that 17 students 
      chose
purple.

  The fewest number of students
      chose
green.

  More students chose blue than red.

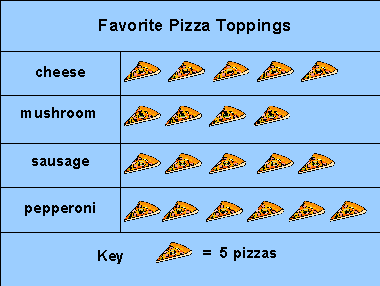
Answer these questions with information
from the bar graph.

    How many people ordered cheese
      pizza? 

    What kind of pizza had the most
       orders? 

    What 2 kinds of pizza had the same
       number of orders?    


Next